Home
Setting up VSCode for debugging
~/.psdtoolsrc
To avoid that the wrong debugger is launched, change Debugger the variable in psdtoolsrc to "true" (will make it fail, which is good)
Debugger "true" # "cvd" for SGI, "totalview" for Linux
VSCode
In the .vscode folder in the psd repository, the following files are located:
- launchjson : Change this when new PSDs are introduced (note there are two JSON elements per PSD, one for HOST and one for TGT)
- settingsjson : Here are the file associations to C code. One can also add/edit
launch.json here
Please also read: https://code.visualstudio.com/docs/editor/debugging
Use VSCode for debugging on HOST
Host debugging - Order of steps
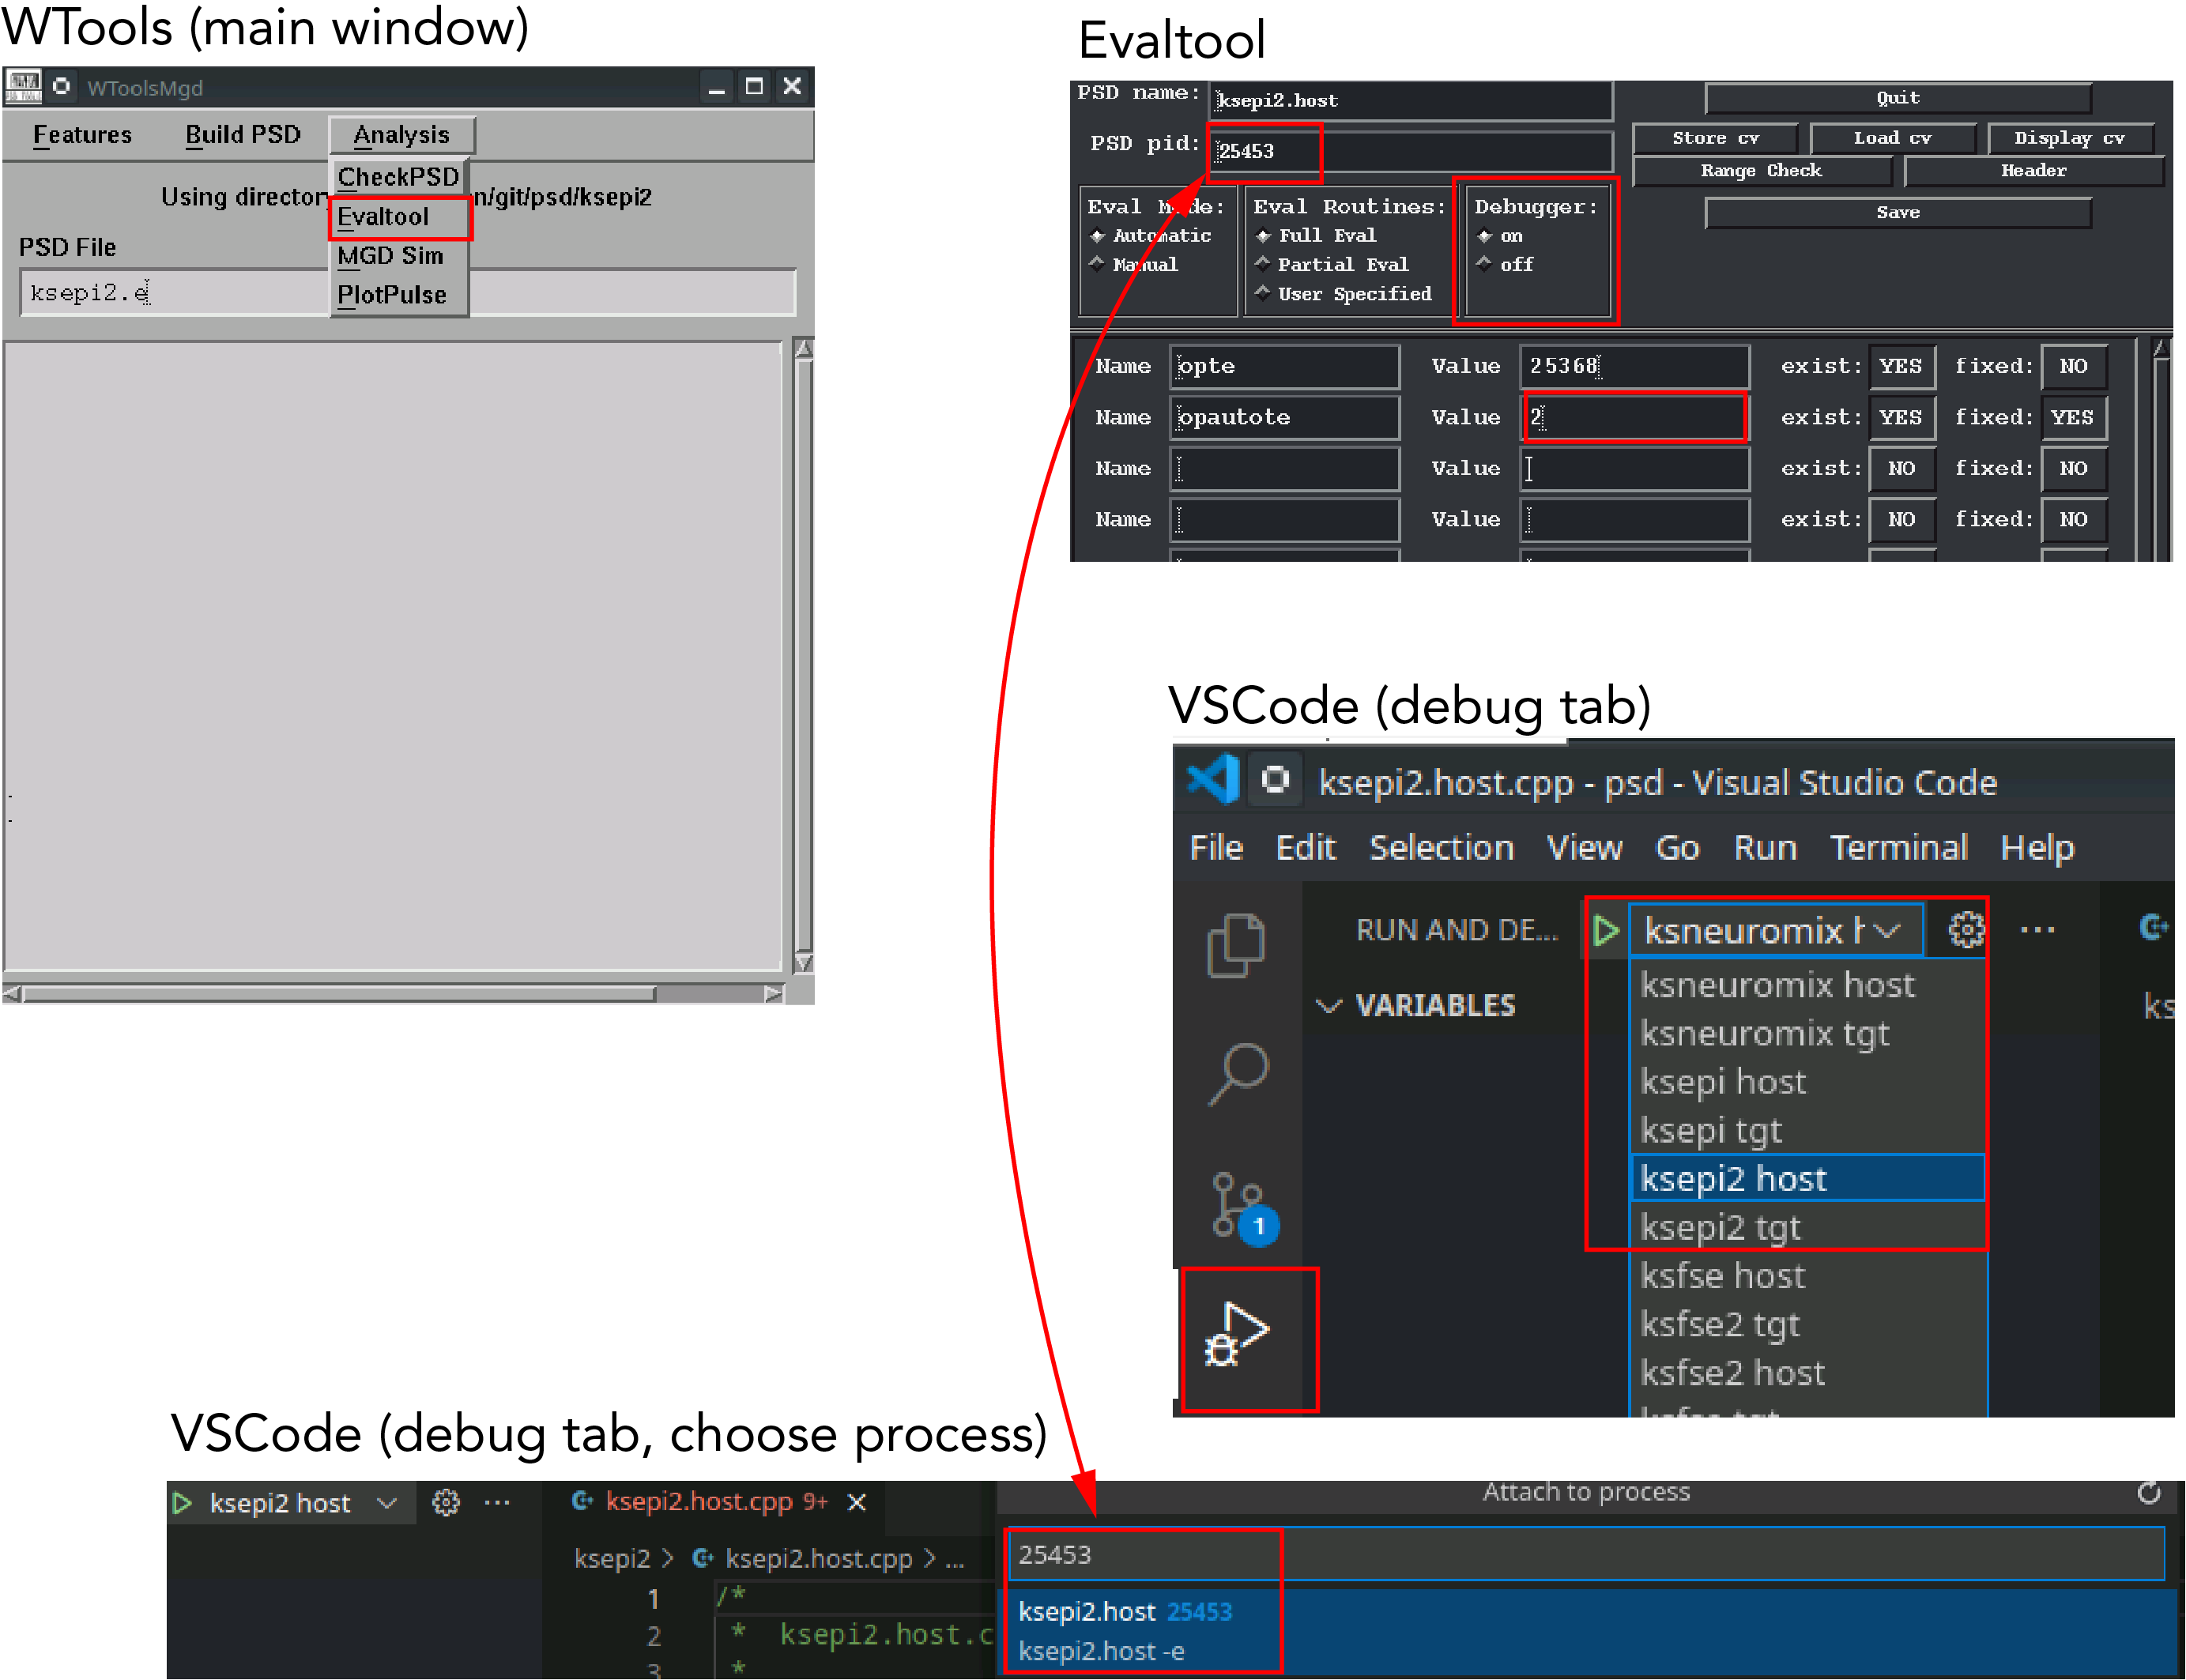
- Open WTools. Select Analysis->Evaltool
- Evaltool: Type in some arbitrary CV (e.g. opautote) and press ENTER in the Value box so that Evaltool executes cvinit(), cveval(), cvcheck(), and predownload()
- Evaltool: Click ”on” under Debugger (If there is no .psdtoolsrc in the user's home directory, the some other debugger may open)
- If some other debugger opens, select File->Detach Process or similar, but the long-term solution is to have a psdtoolsrc file configured to avoid this
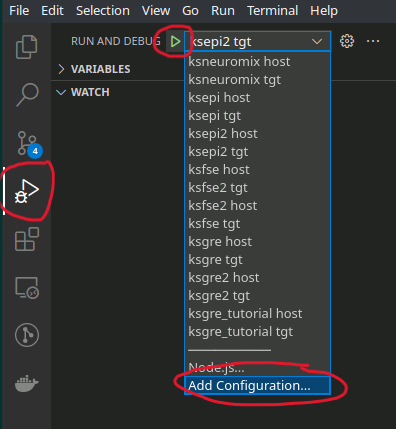
- VSCode: Select the Debugger Tab (Play&bug icon at the left edge of the window) and the down 'v' to the right of the green play button. This opens up the selection of PSDs that have been configured in launchjson
- VSCode: Select the correct "<psd> HOST" config
- VSCode: Press the green play button and and type in the "PSD pid:" shown in EvalToolMgd into "Select the process to attach to". It should say "<psd>.host"
- VSCode: Now, there should be an orange bar at the bottom
- VSCode: For functions that are in any
*.e file, these are debugged in the auto-generated <psd>.host.cpp file. Open this, and search for the function of interest. For functions in a *.cc or *.c file, open the correct file and search for the function
- VSCode: Debug stops can be made by clicking to the left of the row numbers or by typing in the function name under the Breakpoints section in VSCode
- Evaltool: To run, press enter in a CV's Value field
- To modify a CV, first stop the debugger in VSCode, change the CVs needed, and redo the above again
Tip: Use the WATCH section in VSCode to add the whole sequence, e.g. ksepi2_sequence, and unfold stuff of interest
Use VSCode for debugging on TGT
TGT debugging - Order of steps
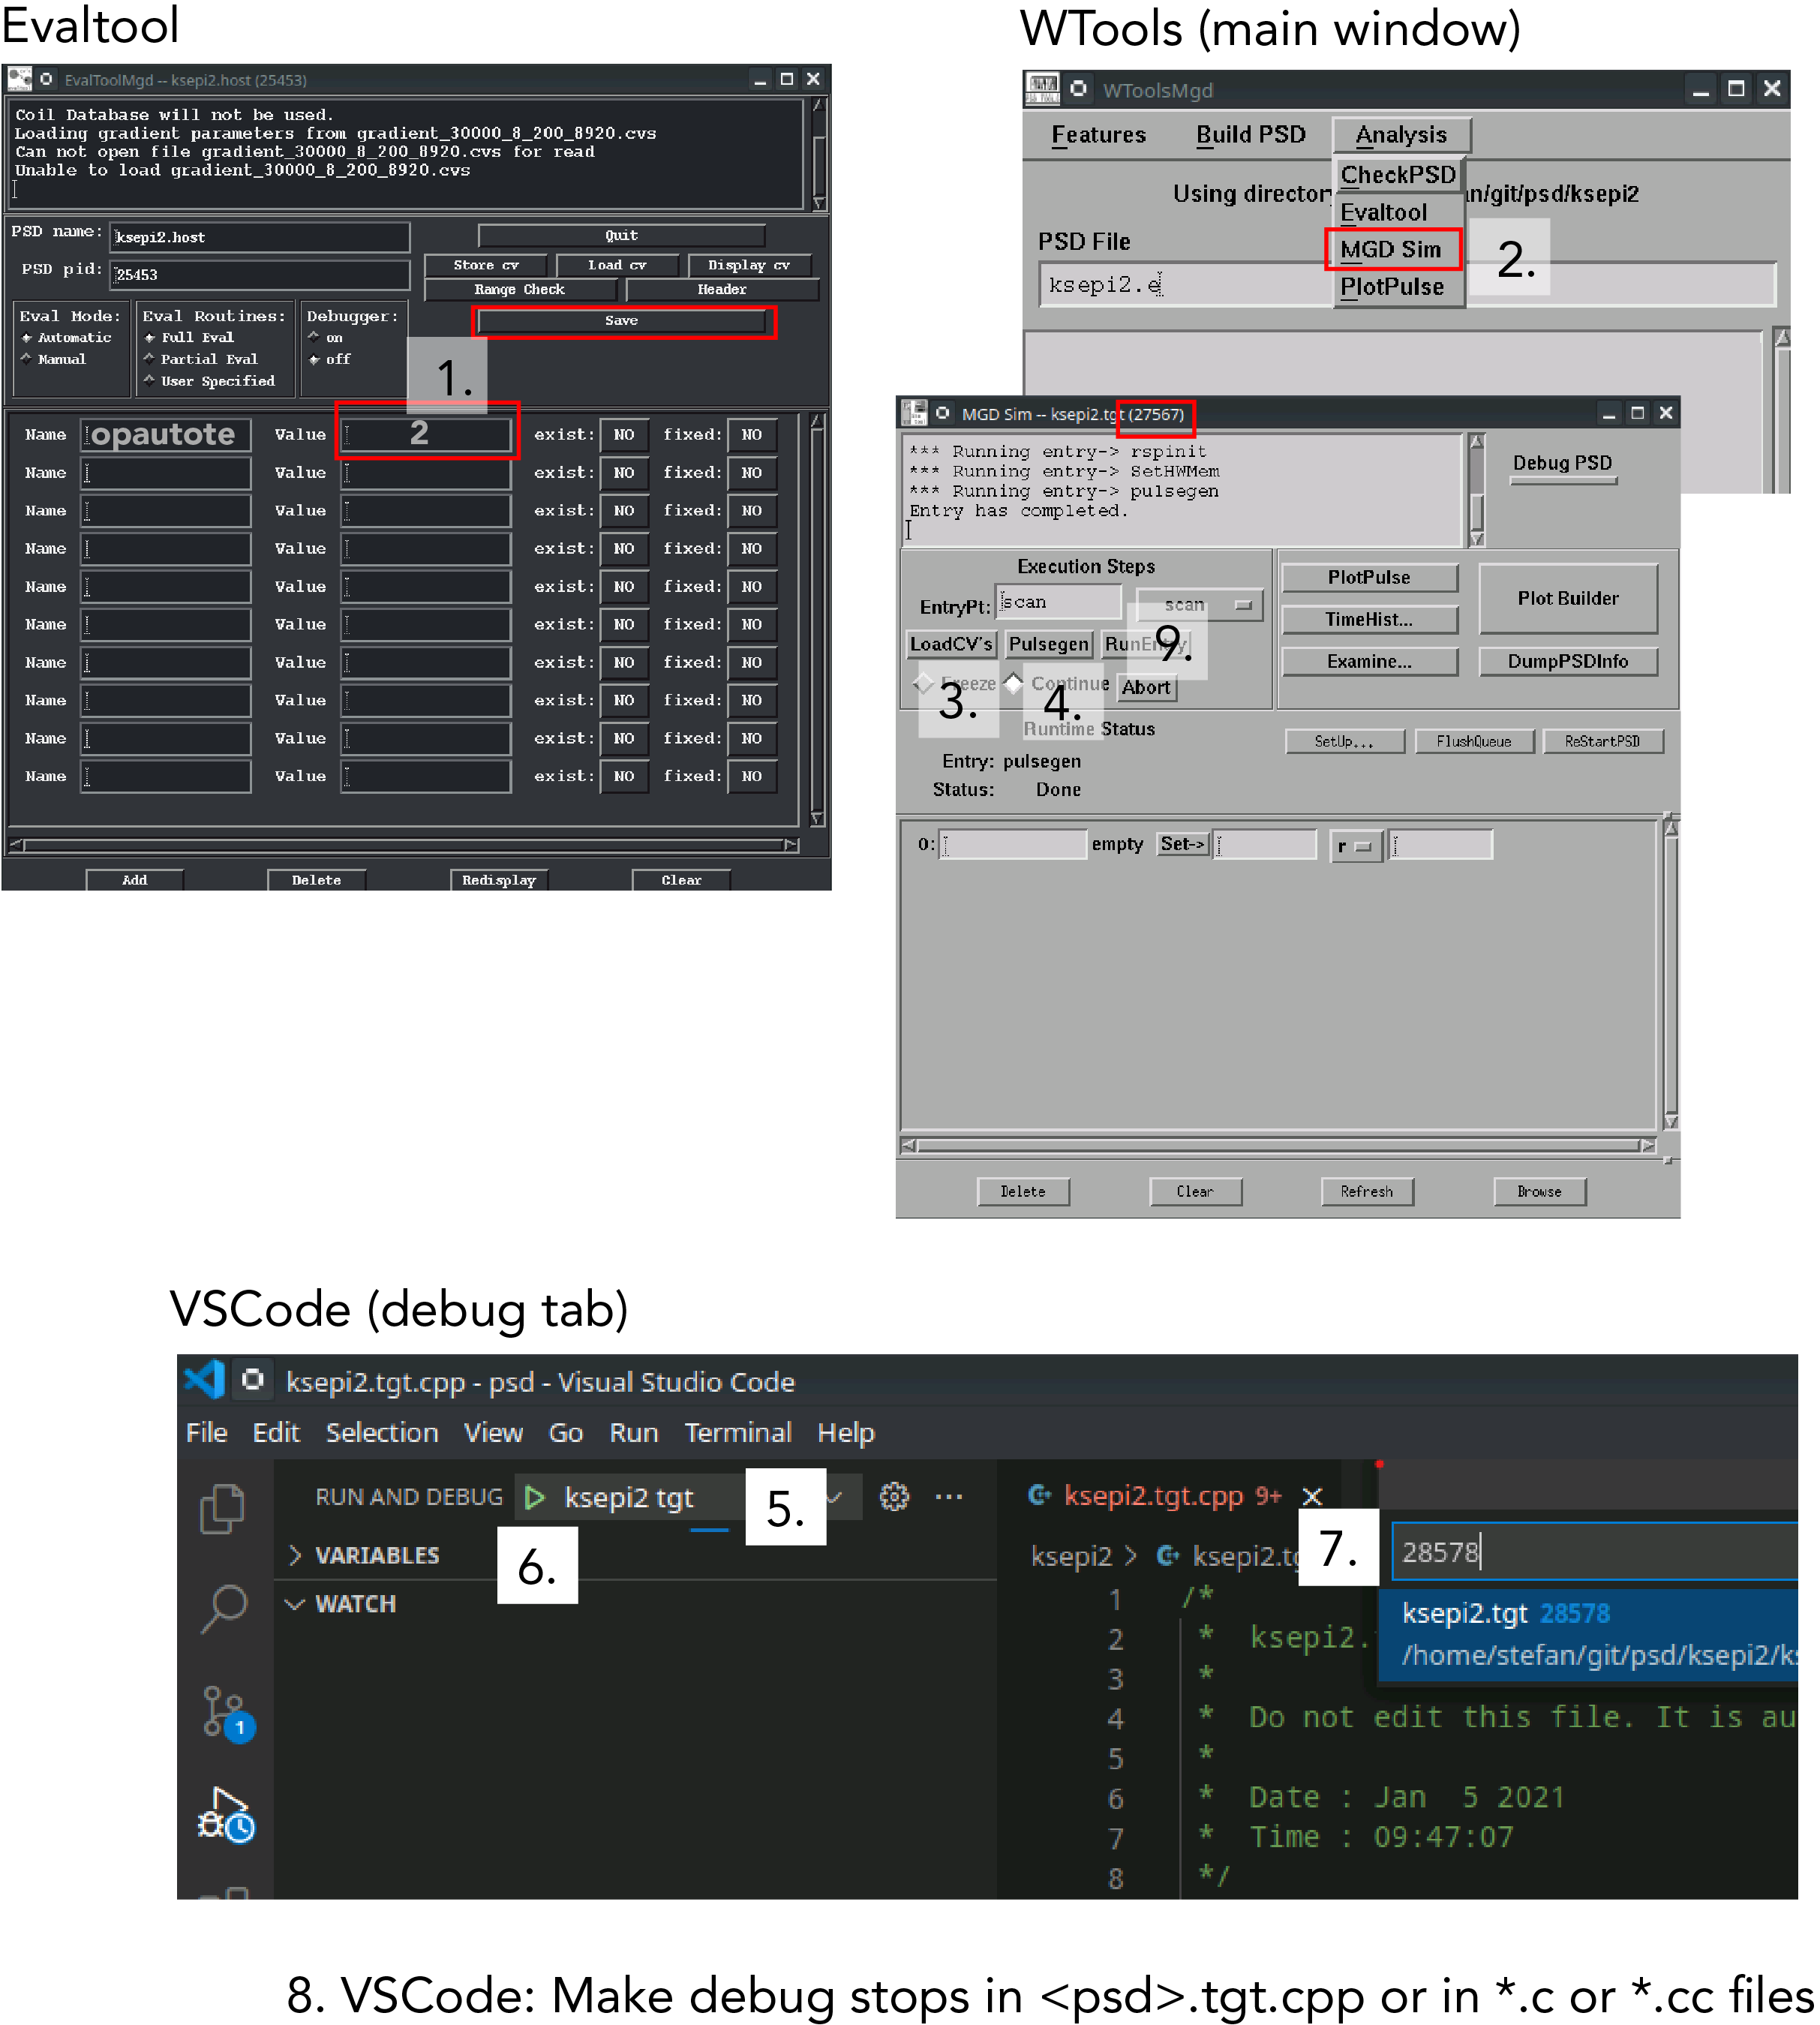
- Make sure Evaltool has evaluated at least once, and that Save has been pressed
- WTools: Open Analysis->Mgd Sim
- MGD Sim:Press LoadCV's
- MGD Sim:Press Pulsegen (Note: There is no need to press "Debug PSD" for debugging to work)
- VSCode: Select the correct "<psd> TGT" profile in the "RUN AND DEBUG" menu (see launchjson)
- VSCode: Press the green play button to the left of the menu
- VSCode: Type the MGD Sim process id shown in parenthesis in the title of the MGD Sim window. Choose <psd>.tgt if there are more than one choice
- VSCode: Make debug stops for *.e files in <psd>.tgt.cpp and directly in *.c and *.cc files
- MGD Sim: Press Run Entry
The order of events is sensitive, borderline critical
Home


